Recently, I've read several claims that we don't need to believe the planet is warming because this winter is going to be one of the coldest winters that Canada has seen in some time. While this logic is intuitive at first, I find myself using the same piece of information to support the opposite hypothesis, namely that climate change is upon us. Why? Simply put, my expectation of climate change is that in addition to warmer weather, we will also see more cold winters.
As anyone's life experience tells them, weather is variable. It changes from hour to hour, from day to day, from season to season, and so on. If somebody records the temperature every day for years and years and years, and looks at the temperature on (for example) September 22nd every year for century, then they will find that on average the temperature was 17 degrees, but that sometimes it was warmer -- as much as 25 -- and sometimes it was colder -- as cold as 5. (I've pulled these numbers out of a hat for demonstration purposes.) If that same person made a table of all the recorded temperatures, looked at how often a given temperature showed up, and graphed the result, then it might look like this:
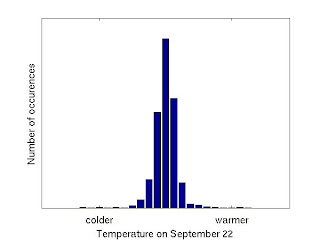
If you gave this information to a statistician, they would try to fit what's called a distribution model to those temperature data, giving something like this:

The model here is a normal distribution, which is like the "Bell curve" teachers might use to adjust grades in a class. In reality, the temperature distributions would not be normal like this; they would have a more complicated statistical distrution. For now, let's just assume that this distribution is good enough, so that I can demonstrate my point.
Now, suppose the climate at our weather station changes. Things get warmer, and more "energy" is put into the weather system. If we do the same study, our new graph might look like this:

It looks pretty similar, but if you look carefully, we can compare the modeled distributions for the two sets of data:

Now we can start to see the effects of the changed climate. The average temperature is higher, there are a lot more really hot days, and also a few more really cold days. It wouldn't be hard to imagine a situation with a lot more hot days and a lot more cold days.
So how do we know that the climate is changing? Statisticians have this trick in their toolbox called extremal analysis. Basically, they use fancy mathematics to determine how often we're going to get those low-frequency events, or extreme events, when we don't have time to wait for them to happen. In addition to a warming "average planet", researchers are seeing more extreme events. There are more hot days, more cold days, more hurricanes, more droughts, more floods, more ice storms, etc., etc. Their findings suggest that the weather systems are experiencing a shift like the one we have just described in the example above. Hence, just because this winter is going to be a cold one, it is not a reason to denounce climate change.


